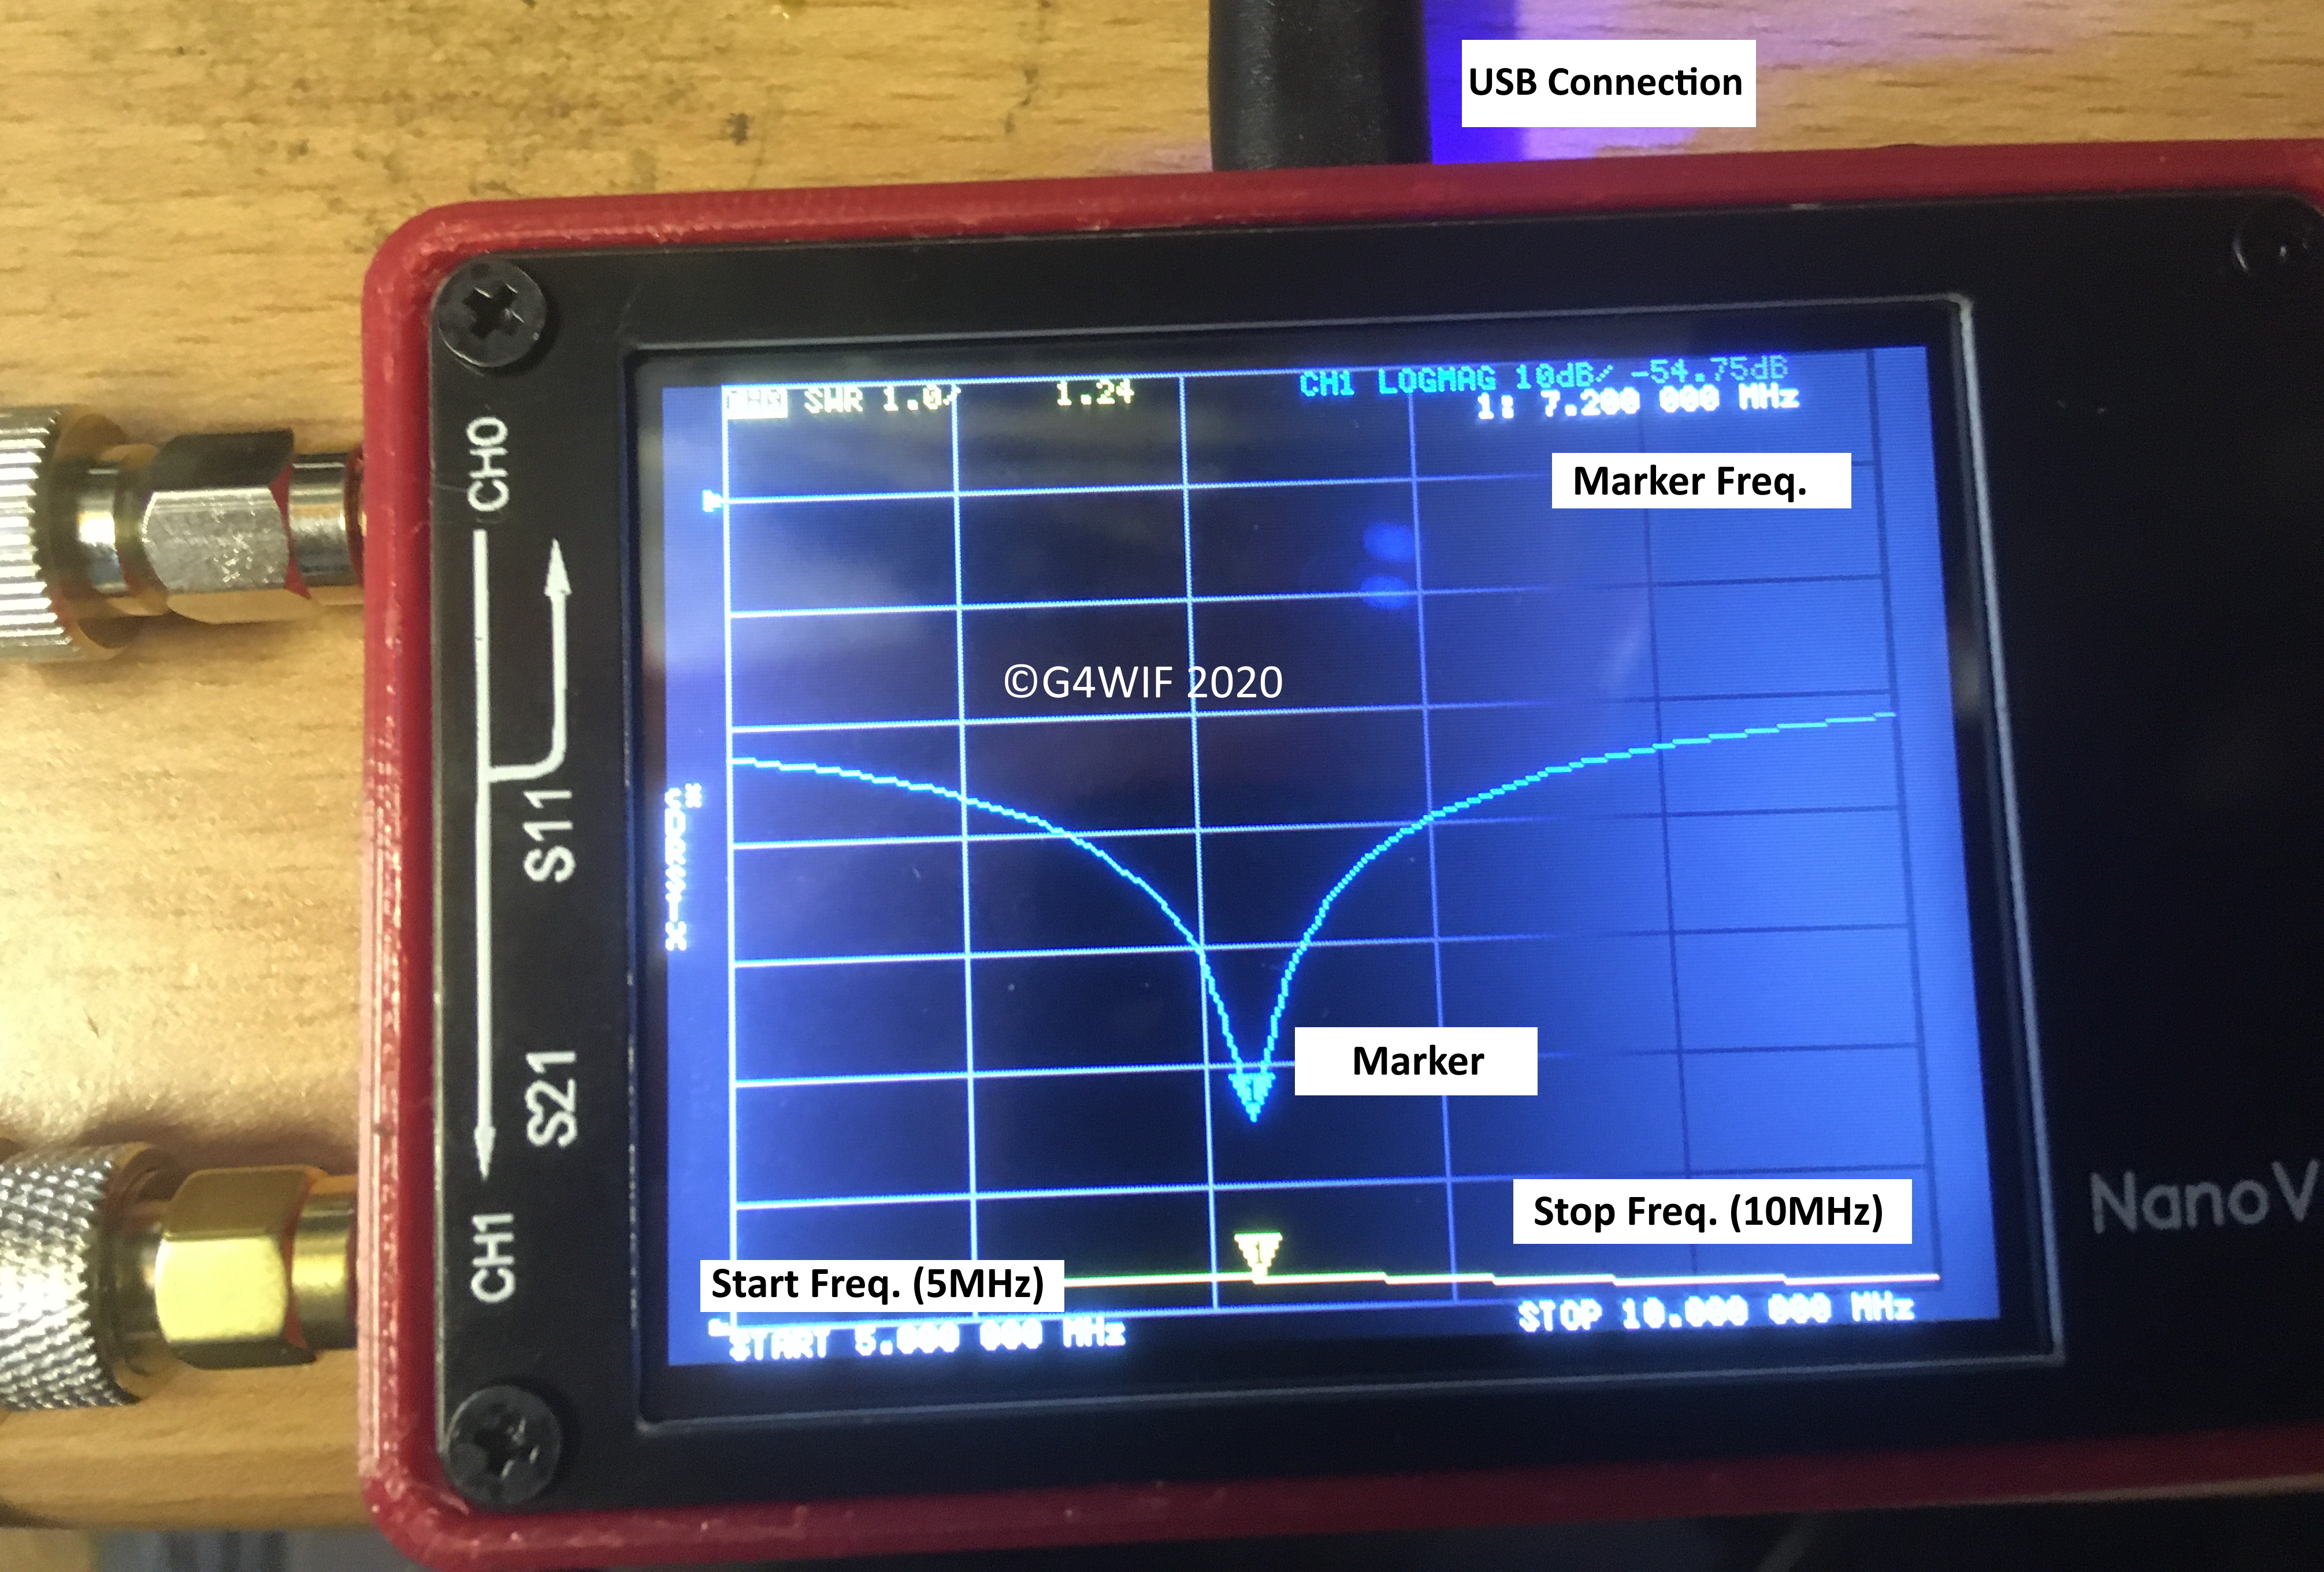

TRANSFORM ON is enabled, the measurement data is immediately converted to the time domain and displayed. Select DISPLAY TRANSOFRM TRANSFORM ON to convert measurement data to the time domain. NanoVNA can simulate time domain measurements by signal processing frequency domain data. Up to 4 markers can be displayed. Markers are displayed from MARKER SELECT MARKER MARKER n . When you display a marker, the active marker is set to the displayed marker. To change the trace channel, select DISPLAY CHANNEL CH0 REFLECT or CH1 THROUGH . NanoVNA has two ports, CH0 CH1 . The following S parameters can be measured at each port.

REACTANCE : The reactance component of the measured impedance.RESISTANCE : Resistance component of the measured impedance.IMAG : Imaginary number of measured value.LINEAR : Absolute value of the measured value.PHASE : Phase in the range of -180 ° to + 180 °.LOGMAG : Logarithm of absolute value of measured value.The display of each format is as follows. Select DISPLAY TRACE TRACE n to display. (If already displayed, it must be temporarily hidden)Įach trace can have its own format. To change the format of the active trace, select the format you want to change to DISPLAY FORMAT .Tap the trace marker you want to activate.The following methods can be used to switch the active trace. Traces can display only what is needed. To switch the display, select DISPLAY TRACE TRACE n . Up to four traces can be displayed, one of which is the active trace. Start measurement Basic measurement sequence


 0 kommentar(er)
